[1]:
import straph as sg
import matplotlib.pyplot as plt
import networkx as nx
[2]:
%matplotlib inline
plt.rcParams["figure.figsize"] = (12,9)
plt.rcParams['animation.html'] = 'jshtml'
from IPython.display import HTML
Visualisation
Straph offers several
visualisations functionalities, all based on matplotlib.
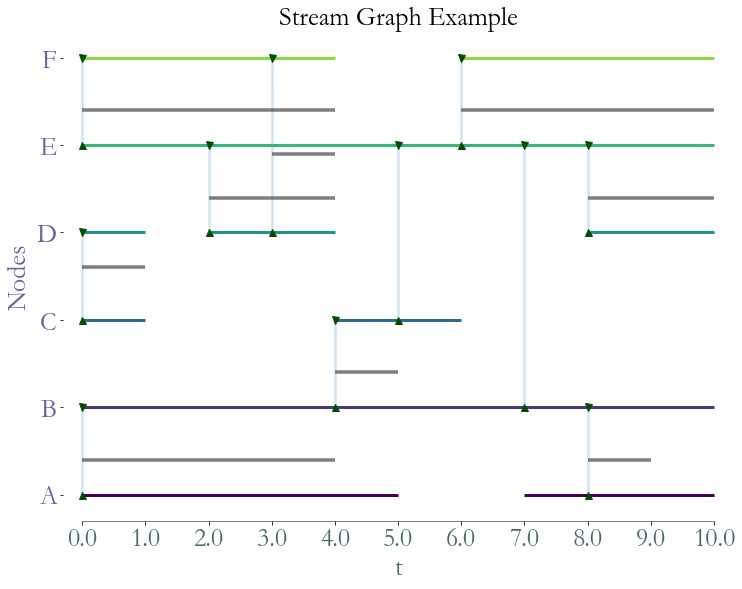
Static global visualisation
[3]:
path_directory = "examples/"
S = sg.read_stream_graph(path_nodes=path_directory + "example_nodes.sg",
                      path_links=path_directory + "example_links.sg")
_ = S.plot(title="Stream Graph Example")
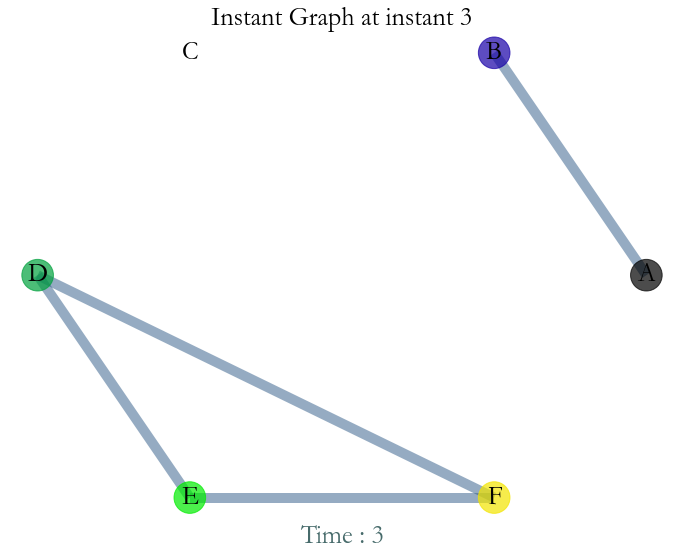
Instant visualisation
[5]:
t = 3
_ = S.plot_instant_graph(time = t, title = "Instant Graph at instant "+str(t))
Dynamic visualisation
We can visualise the dynamics of the stream graph by representing an animation of each snapshots through time.
[6]:
%%capture
anim = S.animated_plot()
[7]:
anim
[7]:
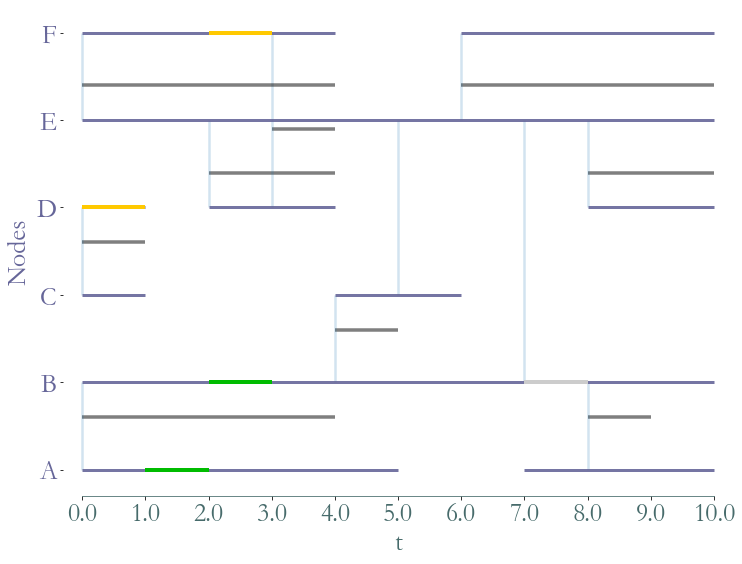
Property visualisation
We can represent clusters (sets of temporal nodes):
[8]:
clusters = [[(1,2,'A'),(2,3,'B')],[(0,1,'D'),(2,3,'F')],[(7,8,'B')]]
_ = S.plot(clusters = clusters)
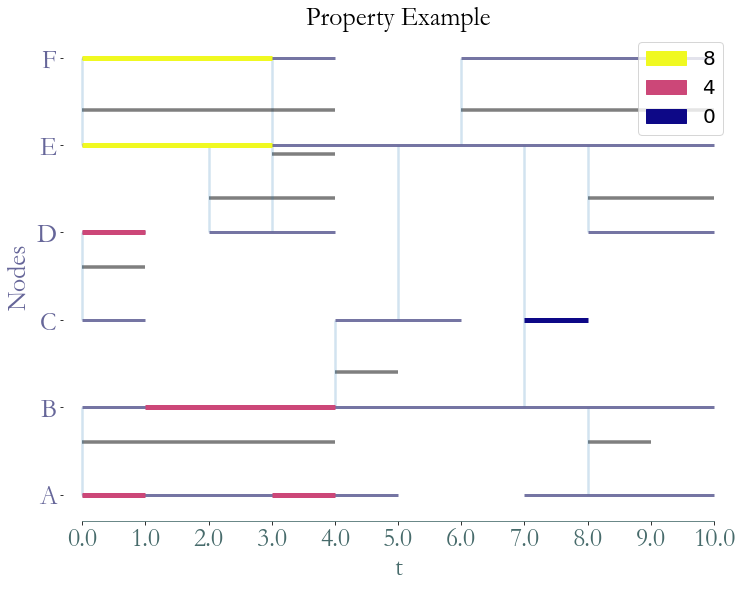
We can represent a given value for a set of temporal nodes with the following method:
[9]:
dict_prop_to_cluster = {4:[(0,1,'A'),(3,4,'A'),(1,4,'B'),(0,1,'D')],8:[(0,3,'E'),(0,3,'F')],0:[(7,8,'C')]}
_ = S.plot(clusters = dict_prop_to_cluster,title= "Property Example")